Mapping, Modeling and More
Real-world data, big data, spatial analytics, mapping and modeling, clustering and layering…what do all these industry terms and catchwords mean?
It depends on who you talk to. And that is part of the problem!
While many established industries have standardized definitions for frequently used words, there’s no common language in the world of predictive analytics. This means one Geographic Information Systems (GIS) firm’s use of the word “modeling” can differ drastically from a site selection consultant’s definition.
Take “clustering,” for example. In some GIS circles, this term refers to spatial groupings related to economic development. It’s all about reporting and mapping. At eSite, we “cluster” not just to report, but to predict consumer behavior based on characteristics of the customer. Then there are the synonyms: some analysts use words like “classification” and “segmentation” instead.
Conflicting definitions like these can make things confusing, to say the least. So what’s an analyst to do?
The eSite Dictionary
To help provide better consistency and clarity to the industry, we’ve put together a list of commonly-used terms and what is most often meant when they are used:
Big Data
Extremely large stores of data, both structured and unstructured. These petabytes of data are gathered everywhere—from transactions, loyalty cards and memberships to internet searches, social media networks, mobile devices and more.
Business Analytics
Business analytics is a generic term referring to all the methods and techniques used by an organization to analyze any kind of performance or influence.
Clustering
The classification of something, usually stores, based on numerous factors, such as sales, proximity to competitors or cotenants, demographics and psychographics in the area surrounding each location. Clustering can also be used to analyze communities, competitors, transactional data and more.
Customer Segmentation
Segmenting household-level customer data by groupings that detail demographic traits, spending behaviors, lifestyle habits and other factors. Segmenting allows a business to anticipate customer behaviors, analyze markets more precisely and select better sites.
Drive Times
In the world of site selection, “drive time” refers to a common method used to create trade areas. This technique relies heavily on generic numbers of miles driven to analyze customer behavior. Drive times are not as reliable a metric as real-world driving data because the time and distance one can travel differs with time of day, like morning rush hour.
Layering
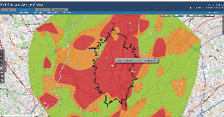
Displaying combinations of data on a map to make it easier to understand and visualize the data than it would be with a traditional spreadsheet approach.
Mapping
At eSite, when we refer to “mapping,” we’re talking about providing multi-unit companies context for where their stores are and should be, based largely on customer location and infrastructure. Mapping lays a framework for spatial analysis.
Marketing Analytics
Analysis of detailed, real-world customer data to guide highly targeted marketing and advertising. Marketing analytics goes beyond simply measuring to identify steps marketers can take to increase conversions and improve response rates.
Modeling
Modeling, at its core, is used to help predict the best possible outcomes. It’s a forecasting process that enables companies to see which methods, sites or solutions score well against a “model” of various influences—both positive and negative—on future store performance, marketing, site selection, staffing and more.
Optimizing
A process used to identify the most promising, lowest-risk opportunities in site selection, market planning, advertising and more.
Predictive Analytics
This term refers to the practice of extracting data to identify patterns and predict future outcomes. Predictive analytics encompasses a wide variety of techniques from statistics to modeling to data mining. At eSite, we use predictive analytics techniques to help retailers, restaurants and others find their next best location.
Radius Rings
Radius rings are concentric circles based solely on distance. A common method for evaluating potential sites, a ring is derived by drawing a circle around a location to view information on people who live within that sphere. With radius rings, ten miles is ten miles— whether you’re looking at downtown Manhattan or rural Indiana.
Real-World Driving Data
Highly detailed records of anonymous data from customers’ actual driving patterns. Real-world data goes beyond basic residential zip codes and places of employment to reveal generalized origin and destination for any consumer trip, with extreme efforts going into protecting people’s privacy in the process.
Spatial Analysis
Spatial analysis turns raw spatial data into meaningful, actionable customer insights. The process involves evaluating stores, cotenants and competitors, as well as demographic and psychographic influences, to provide highly accurate forecasts.
Spatial Data
“Spatial” refers to the locational elements of business data—mailing addresses, zip codes, trade areas, territories, proximity to competitors and so on. By introducing elements related to travel, time and distance much deeper insights can be derived than with a typical database approach.
Are there any terms you’d like us to add? Have questions about eSite’s definitions? We’ll be updating this list as the site selection industry grows and changes, so email us with your questions and suggestions.

